SOLVED Timeout service - alert configuration
-
Please help by indicating if there is any alert to be able to monitor if a service responds with timeout.
-
Greetings,
I will tell you how to get a mail notification when a service returns a time out error. The settings I describe here will work for all services running on your domain.- The following settings are valid if the service’s timeout logs can be monitored via diagnostic log.
- If the service throw “Caused by: java.net.ConnectException: Connection timed out” in the diagnostic log file, these settings can be used.
- To investigate the issue in depth, I would kindly ask you to tell us what kind of service you are using and send us the log file with the errors returned by this service.
By following the steps below, you will create a Log Inspector Notifications rule. When this rule is defined, e-mail notification will be sent automatically.
Instructions
Create Log Inspector Rule
- Expand the Configuration category.
- Click on the Monitoring & Diagnostics tool.
- Click on the top right button (the button marked 2 in Figure 1).
- In the pop-up window specify the name of your Log inspector. We recommend that the name chosen here is chosen carefully so that it is easy to understand later.
- Select Diagnostic Log*[1]* as Log Type and click Next.
- Type “Caused by: java.net.ConnectException: Connection timed out” in the Search String box. (Double quotes should be deleted.)
- Turn off the Case Sensitive option.
- Under Row/Line Fetch Method, select “Current line”.
- Turn on Attach Line(s). Type 15 in the before and after boxes. (This value will print the first 15 and last 15 lines when the searched word is found in Search String). Click the Next button.
- Click on Managed servers. You will see that it moves to the right side. Click Next.
- Set Tail Line Count as 1000. (This is the recommended value. It can be changed later).
- Set Result Match Count to 1. (This is the recommended value. It can be changed later.) If this value is set to 1, notification will be provided for each match.
- Turn on Enable Current Monitoring Configuration. Click on the Save button.
You will automatically receive email notifications from all the settings you make here. If you want to check manually, you can use the Log Inspector Notifications tool (Figure 6).
(Representative screenshots of the steps are below.)[1] Enable you to access diagnostic data about specific feature components in Oracle Fusion Middleware.
Representative Screenshots
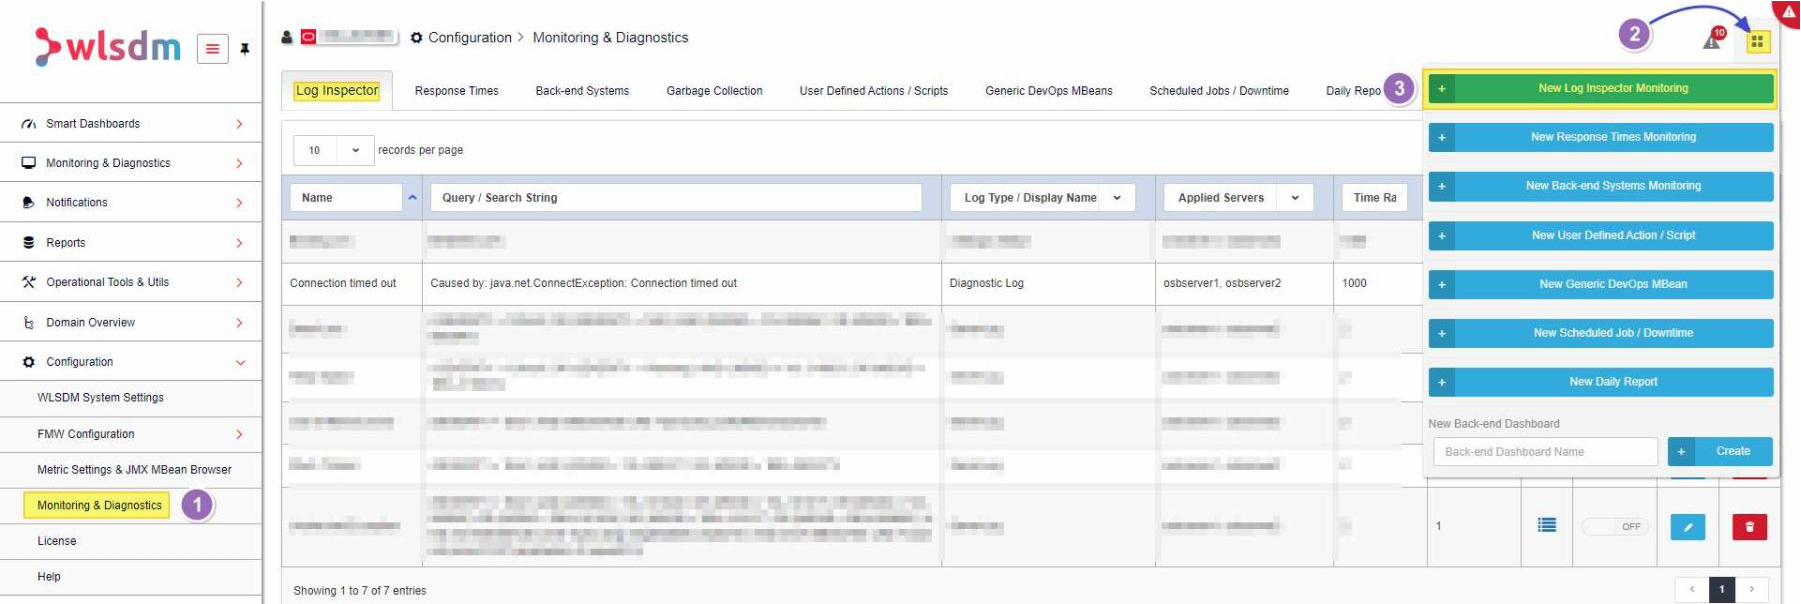 Figure 1
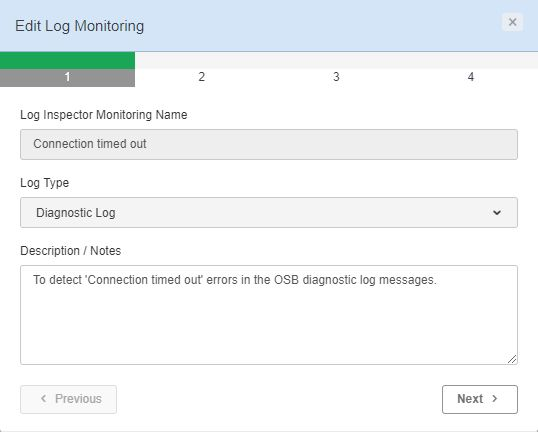 Figure 2
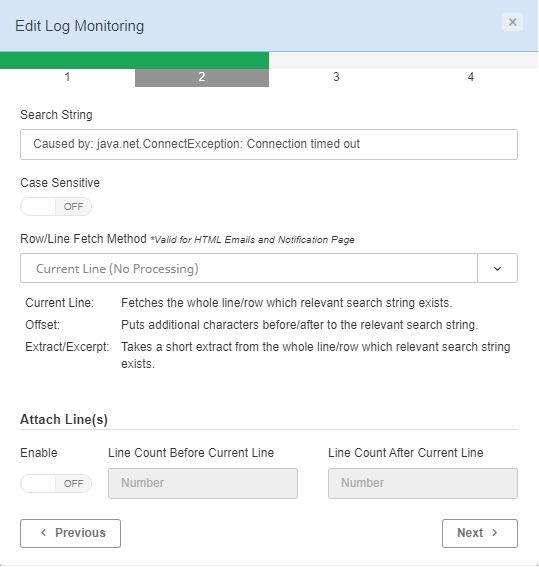 Figure 3
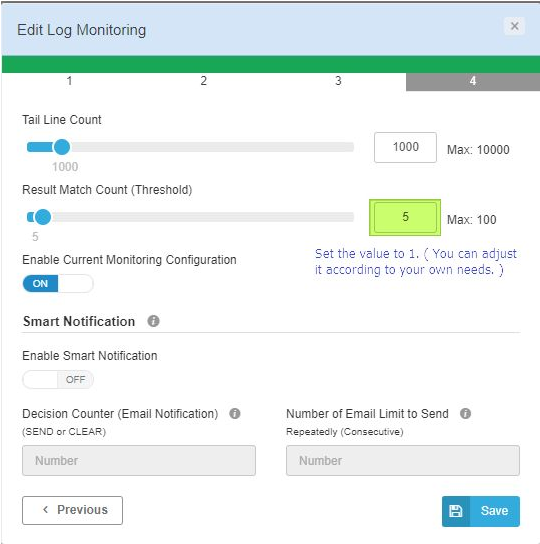 Figure 4
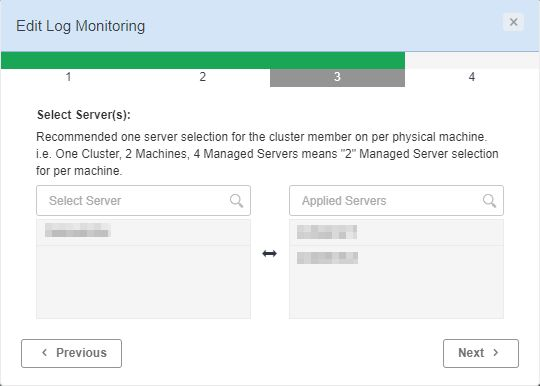 Figure 5
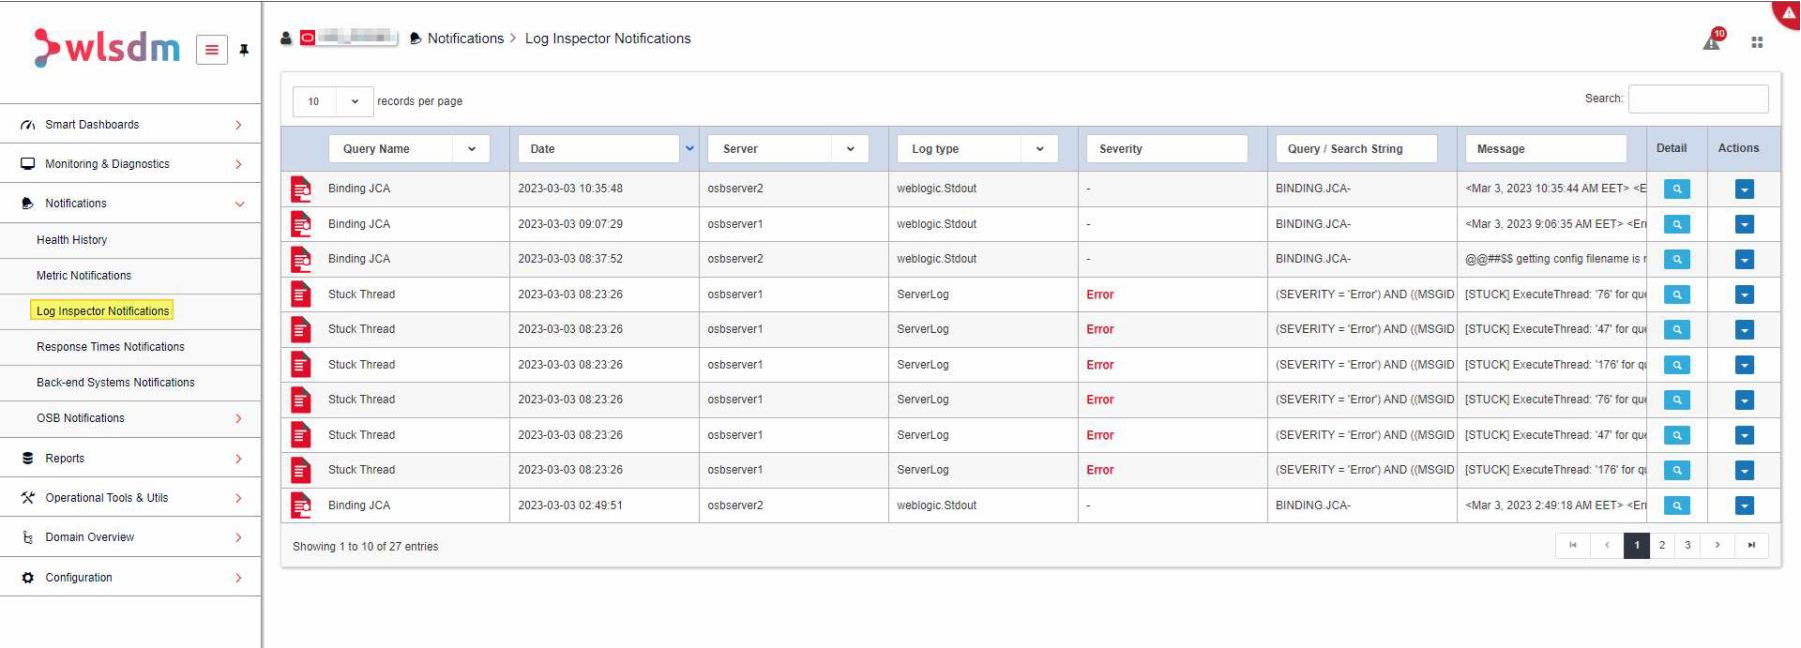 Figure 6
Best regards.
-
Greetings,
I will tell you how to get a mail notification when a service returns a time out error. The settings I describe here will work for all services running on your domain.- The following settings are valid if the service’s timeout logs can be monitored via diagnostic log.
- If the service throw “Caused by: java.net.ConnectException: Connection timed out” in the diagnostic log file, these settings can be used.
- To investigate the issue in depth, I would kindly ask you to tell us what kind of service you are using and send us the log file with the errors returned by this service.
By following the steps below, you will create a Log Inspector Notifications rule. When this rule is defined, e-mail notification will be sent automatically.
Instructions
Create Log Inspector Rule
- Expand the Configuration category.
- Click on the Monitoring & Diagnostics tool.
- Click on the top right button (the button marked 2 in Figure 1).
- In the pop-up window specify the name of your Log inspector. We recommend that the name chosen here is chosen carefully so that it is easy to understand later.
- Select Diagnostic Log*[1]* as Log Type and click Next.
- Type “Caused by: java.net.ConnectException: Connection timed out” in the Search String box. (Double quotes should be deleted.)
- Turn off the Case Sensitive option.
- Under Row/Line Fetch Method, select “Current line”.
- Turn on Attach Line(s). Type 15 in the before and after boxes. (This value will print the first 15 and last 15 lines when the searched word is found in Search String). Click the Next button.
- Click on Managed servers. You will see that it moves to the right side. Click Next.
- Set Tail Line Count as 1000. (This is the recommended value. It can be changed later).
- Set Result Match Count to 1. (This is the recommended value. It can be changed later.) If this value is set to 1, notification will be provided for each match.
- Turn on Enable Current Monitoring Configuration. Click on the Save button.
You will automatically receive email notifications from all the settings you make here. If you want to check manually, you can use the Log Inspector Notifications tool (Figure 6).
(Representative screenshots of the steps are below.)[1] Enable you to access diagnostic data about specific feature components in Oracle Fusion Middleware.
Representative Screenshots
Figure 1
Figure 2
Figure 3
Figure 4
Figure 5
Figure 6
Best regards.
-
Thanks for your help.
-
We are very glad that you have resolved the issue and it was a great pleasure to support you.
Best regards