how can I know through the wlsm that queue mq is currently affecting the managed nodes?
Go to “Configuration > Metric Settings & JMX MBean Browser” then click “JMX MBean Browser (+Add New)” button for navigate below modal window then create new JMX MBean for JMS metrics in 8 steps.
1.jpg
how to know on which node managed I have agent configured from the wlsdm?
You can check which managed server has WLSDM agents in “Operational Tools & Utils > Monitor WLSDM Agents” page; but there is no need to WLSDM agent to monitor stuck threads.
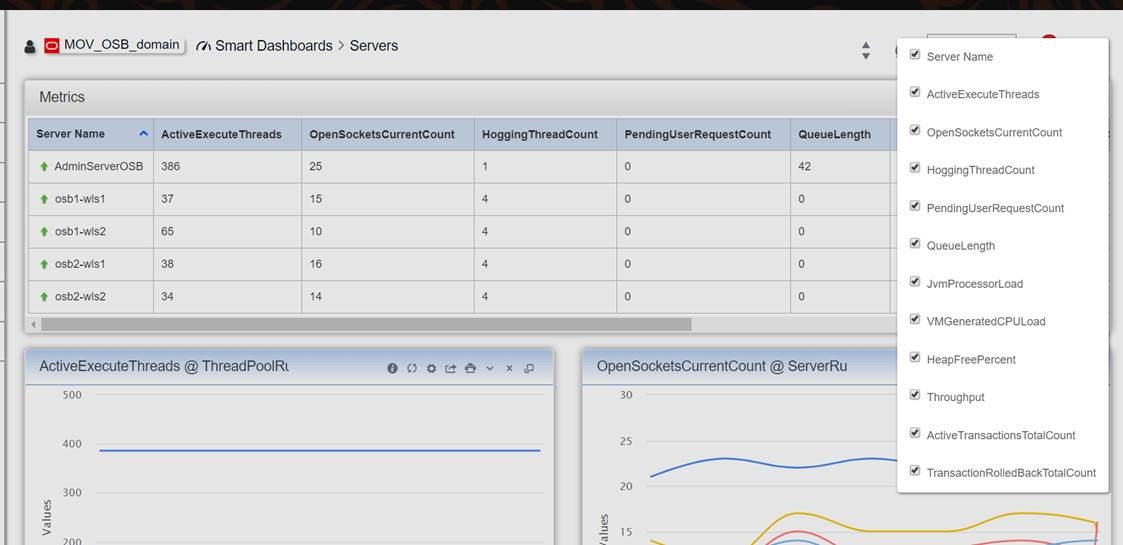
because the stuck thread dashboard does not appear on the path: Smart Dashboards Servers, but I do see hoggingthreadcount information
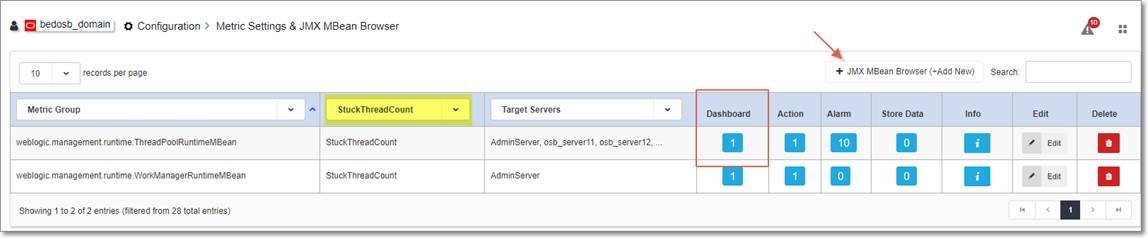
• Check dashboard count for “StuckThreadCount” metric in “MBean Browser” pool it must be select at least 1 dashboard…
• If there is no “StuckThreadCount” metric; you must add from “JMX MBean Browser” button.
3.jpg