Remote Webservice Monitoring with CURL on WLSDM
-
Webservice performance monitoring is quite simple to visualize and take action to URL:port monitoring. WLSDM DevOps MBean allows multiple URL monitoring in one dashboard.
The DevOps MBean consists of the following file parts:
WLSDM-CURL.sh,WLSDM-SOAPRequest.xmlandWLSDM-CURLFormat.txt. Edit script files as below depend on your environment and start to monitor your service performance.
WLSDM DevOps MBean Script:
- Edit WS endpoint URL
- Edit SOAP Request
CURL Request:
curl --max-time 29 -o /data/webadmin/volthread/scripts/wlsdm.monitoring/curl.ws/response.xml -H "Content-Type: application/soap+xml; charset=UTF-8" \
     -d@/data/webadmin/volthread/scripts/wlsdm.monitoring/curl.ws/soap-request.xml    \
      http://127.0.0.10:80/VolthreadHelloWait/HelloWaitWebServicePort  \
     -w "@/data/webadmin/volthread/scripts/wlsdm.monitoring/curl.ws/curl-format.txt" -s -o /dev/null
SOAP Request:
<soap:Envelope xmlns:soap="http://www.w3.org/2003/05/soap-envelope" xmlns:hel="http://hellowaitwebserviceapp.volthread.com/">
   <soap:Header/>
   <soap:Body>
      <hel:sayHello>
         <!--Optional:-->
         <name>Fevzi Korkutata</name>
         <!--Optional:-->
         <waitSecond>0</waitSecond>
      </hel:sayHello>
   </soap:Body>
</soap:Envelope>
WLSDM-CURLFormat.txt
time_namelookup=%{time_namelookup}\n
time_connect=%{time_connect}\n
time_appconnect=%{time_appconnect}\n
time_pretransfer=%{time_pretransfer}\n
time_redirect=%{time_redirect}\n
time_starttransfer=%{time_starttransfer}\n
response_time_total=%{time_total}\n
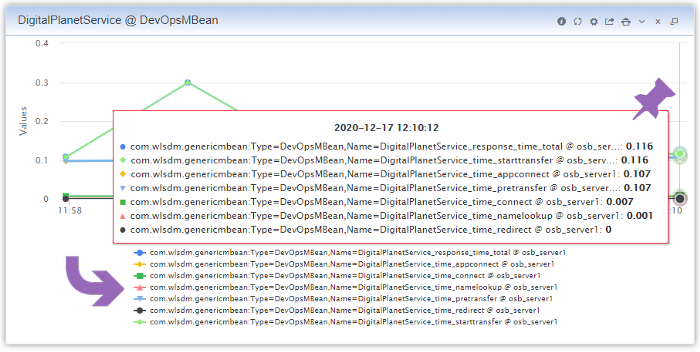
WLSDM Chart Output:
