CPU Load Alert Notification
-
Hi,
We have external monitoring sends out email alert whenever the CPU load on the VM (server) above the threshold. Why is the ProcessCPU metric not sending the similar notification? Or is there any other metric that we should be configuring for this?
Thanks,
Jeba. -
Hi Jeba,
“ProcessCpuLoad” (JVM) metric added to Servers dashboard as default. But “SystemCpuLoad” is not.

For adding this metric to a dashboard and configuring its notifications, please follow the instructions:
Note: This metric provided by JVM and depends on Java version and operating system.
-
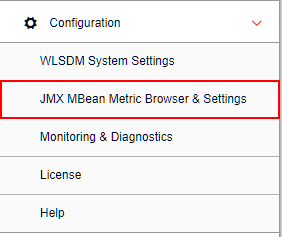
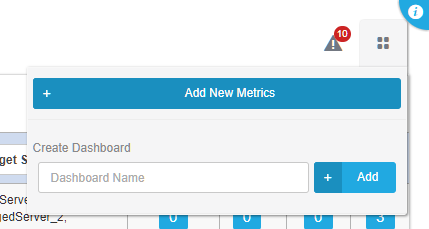
First, go to Configuration > JMX MBean Metric Browser & Settings page and open Add New Metrics window.
-
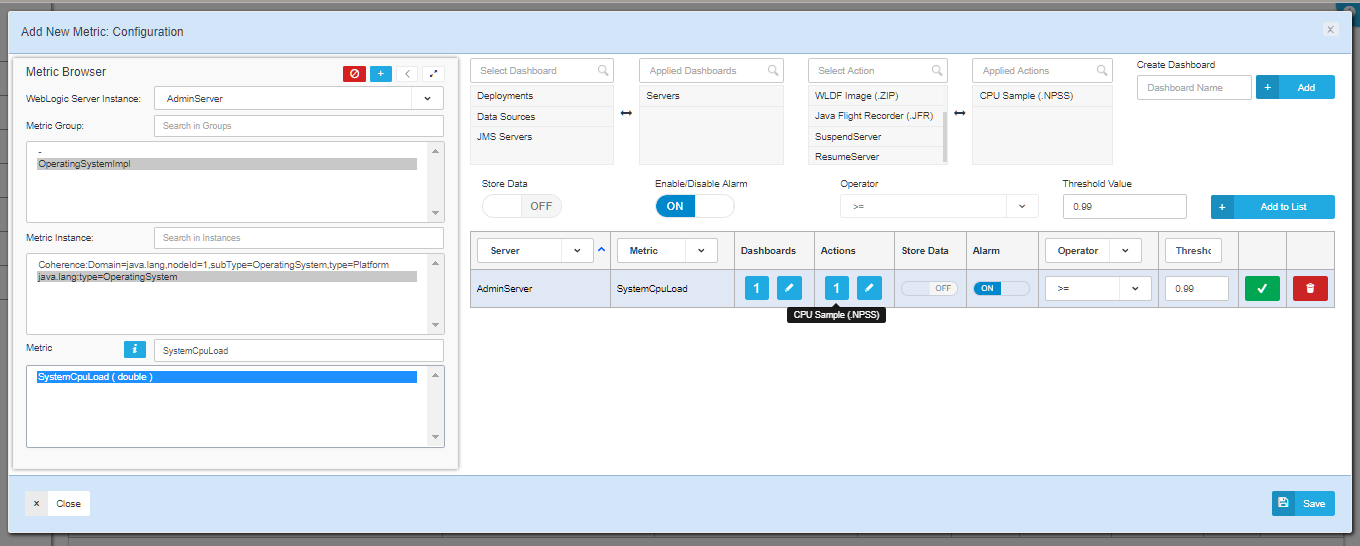
Select your server to monitor.
-
Search SystemCpuLoad metric on metric list.
-
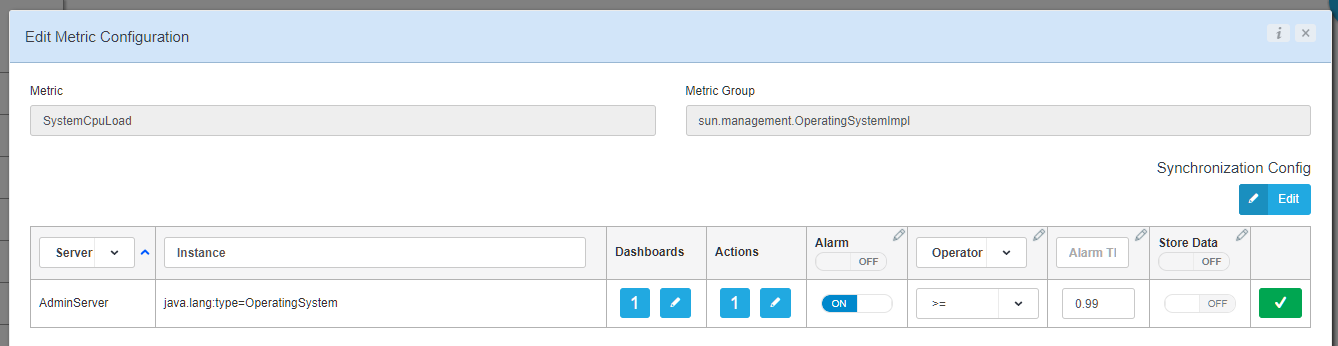
Configure the metric to your needs and add to list (Dashboards, Threshold, Actions…)
-
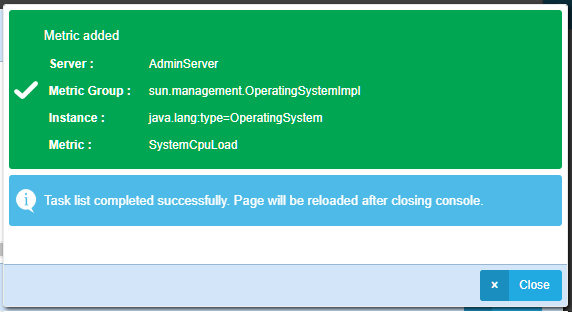
Click the save button.
-
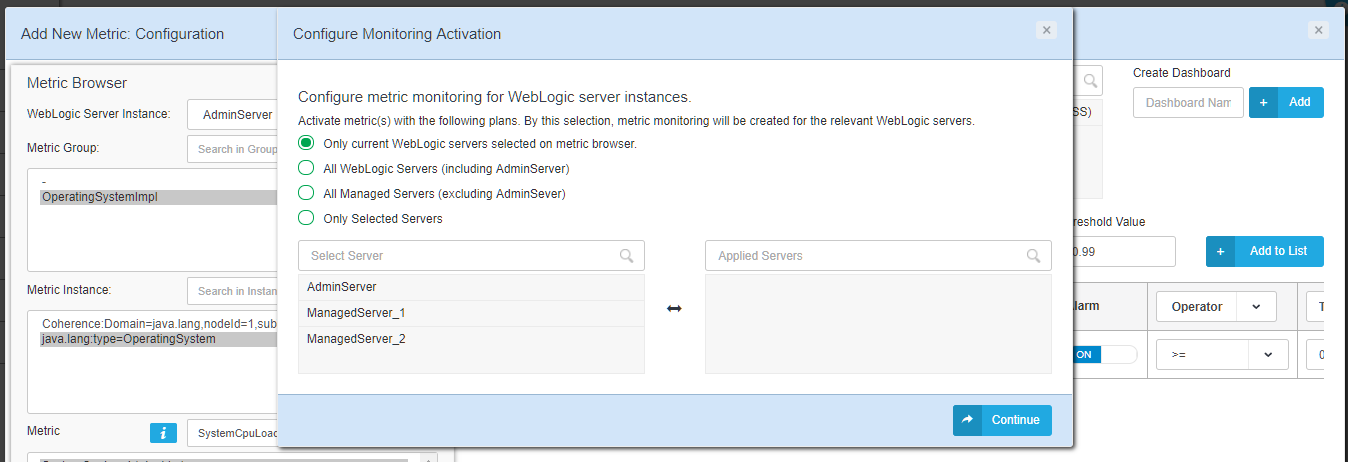
Choose an option on the list and click continue button.
(Best practise is one server for one pyhisicle machine)
-
Close the window
-
Check the metric on the current page and make changes if you need.
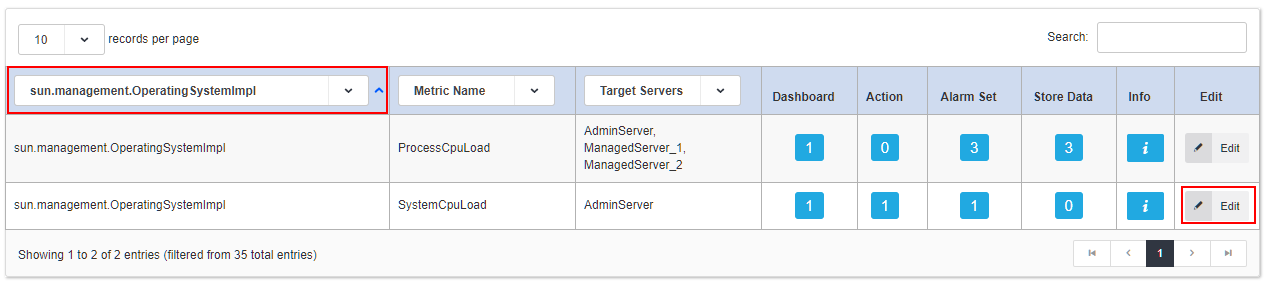
-
Finally, go to your dashboard and check the metric

-
-
Thank you so much. I will give it a try and let you know whether this works in our scenario or not. Thanks.