Navigation

    Best APM Solution for Oracle WebLogic Server & FMW Product Family
    • Register
    • Login
    • Search
    • Recent
    • Tags
    • Download

    Response times is not displayed

    General Support & Troubleshooting
    oracle weblogic responsetimes wlsdm
    2
    2
    1228
    Loading More Posts
    • Oldest to Newest
    • Newest to Oldest
    • Most Votes
    Reply
    • Reply as topic
    Log in to reply
    This topic has been deleted. Only users with topic management privileges can see it.
    • wlcommunityusers
      wlcommunityusers last edited by wlcommunityusers

      Hi,

      We have refreshed the access logs , But the response time is not displayed.

      Regards.

      1..jpg

      Community Users Case Notes (Diary)

      wlsdmsupport 1 Reply Last reply Reply Quote 0
      • wlsdmsupport
        WLSDM Support @wlcommunityusers last edited by wlsdmsupport

        Hi,

        1. Are you sure you have created HTTP transactions for the relevant managed server? Remember you need to create real traffic to exceed 8kb buffer size for the response times monitoring. So, at least there must be +100 request after managed server restart.

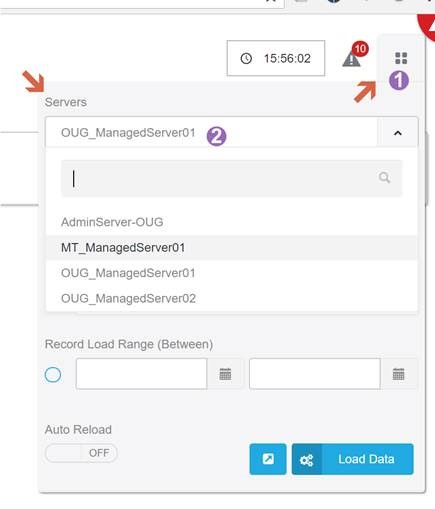
        2. Are you sure you have selected the right managed server on the “Response Times” page? (Please take below screen capture as a reference)

        2..jpg

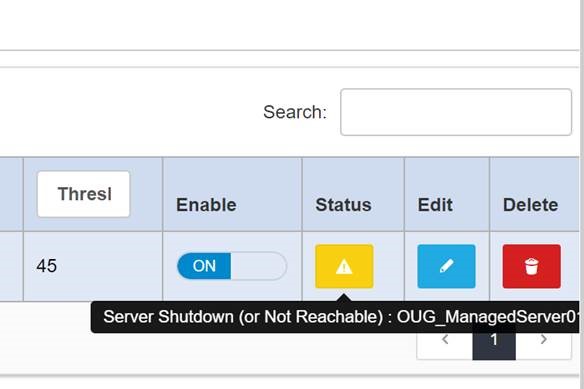
        1. Go to “Configuration > Monitoring & Diagnostics > Response Times (tab)” page and check the status. Is there any server needs to be restarted?
          3..jpg

        Kind Regards…

        WLSDM Community Support Team

        1 Reply Last reply Reply Quote 0
        • 1 / 1
        • First post
          Last post

        WLSDM: Native WebLogic Monitoring & Diagnostics

        Copyright © 2021 WLSDM Community & Support Portal | WLSDM.COM | WLSDM Blog