With WLSDM WebLogic console, can we monitor deadlock in JVM threads ?
-
Can we monitor deadlock in JVM threads? Plus, do we need to turn ON STORE DATA option individually for each component or can it be done centrally also?
-
We have Thread Dump action. Just activate ThreadDump action for Hoggers or Stuck metrics and then analyze thread dumps by using “Thread Dump Analyser”. If your Administrator good enough you can write your own scripts for detecting deadlocks on JVM threads.
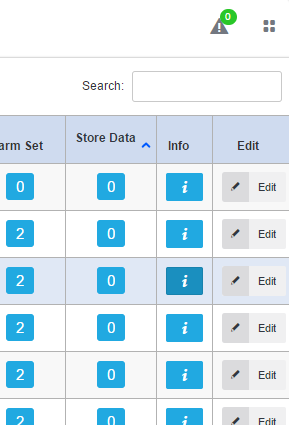
Normally, WLSDM stores 24 hours data storage for MBeans and backend usage by default. But, all chart values can be stored on WLSDM database by turning it on. You can turn on “Store Data” for every data while setting up WLSDM wizard. After the installation, if you have not turned on “store date”, you need to open them by one by. Good news, you can sort them all on "
• Configuration
• > JMX MBean Metric Browser & Settings” page by sorting “Store Data” column. Just follow notifications on relevant notifications page. They’re stored for three months. Remember we have PURGE and ARCHIVE modules. You do not need to operation your monitoring console. It does everything for you.
