Navigation

    Best APM Solution for Oracle WebLogic Server & FMW Product Family
    • Register
    • Login
    • Search
    • Recent
    • Tags
    • Download
    1. Home
    2. Recent
    Log in to post
    • All categories
    • All Topics
    • New Topics
    • Watched Topics
    • Unreplied Topics
    • J

      Dashboard withought Main Menu
      General Support & Troubleshooting • • jorfergo

      4
      0
      Votes
      4
      Posts
      1842
      Views

      wlsdmsupport

      Hi @jorfergo,

      The current WLSDM release doesn’t support this feature.

      Please add your exact requirement on this topic: http://community.wlsdm.com/topic/18/wlsdm-new-features-requests

      We will implement in the next release if our analyze team approve.

      Regards.

    • Can we edit log monitoring parameters as most of generic words are to be monitored in different logs and configuring same keywords again is repeated task?
      General Support & Troubleshooting • • wlcommunityusers

      2
      0
      Votes
      2
      Posts
      1437
      Views

      wlsdmsupport

      Hi,

      We are not supporting multiple log files (types) for a query/monitoring.

      So currently you should repeat the monitoring queries.

      But, you can assign the query to multiple servers for the “ServerLog”, “stdOut”, “stdErr” and “Diagnostic Log” types.

      Kind Regards.

    • C

      SOLVED WLSDM Error: javax.servlet.ServletException: java.lang.NoSuchMethodError: com.wlsdm.genericmbean.A.J.getPropsForConfig(Lcom/wlsdm/genericmbean/data/Config;Ljava/lang/String;)Ljava/util/Properties;
      General Support & Troubleshooting • • catgovind

      6
      0
      Votes
      6
      Posts
      2369
      Views

      wlsdmsupport

      @catgovind said:

      Thank you so much. It is working perfectly.

      We will add additional NOTE to WLSDM readme in the next release. Thank you for reporting it.

      Regards…

    • Do we have the feature in WLSDM to search same string for multiple WebLogic log files?
      General Support & Troubleshooting • log inspector log files weblogic logmonitoring • • wlcommunityusers

      2
      0
      Votes
      2
      Posts
      1609
      Views

      wlsdmsupport

      Hi,

      WLSDM doesn’t support the multiple log files for log monitoring.

      The current algorithm based on, “one log file, one search string” rule.

      So, currently, there is no easy way to do this.

      But we are going to report your request for the next WLSDM version.

    • Metric Alert for JVM System Resources is not working
      General Support & Troubleshooting • • wlcommunityusers

      2
      0
      Votes
      2
      Posts
      1716
      Views

      wlsdmsupport

      Hi,

      ProcessCPULoad metric values are sets between (zero) 0 and (one) 1 as “java.lang.Double” by the JVM.

      So “1” means 100%.

      To get an alert (for testing purpose), you should set the threshold value to less than “1”. eg. “0.01” (1%)
      3.png

    • Can we edit log monitoring configuration as multiple log files (types) for a query/monitoring?
      General Support & Troubleshooting • weblogic wlsdm • • wlcommunityusers

      2
      0
      Votes
      2
      Posts
      1632
      Views

      wlsdmsupport

      Hi,

      We are not supporting multiple log files (types) for a query/monitoring.

      So currently you should repeat the monitoring queries.

      But, you can assign the query to multiple servers for the “ServerLog”, “stdOut”, “stdErr” and “Diagnostic Log” types.

      Kind Regards…

    • SOLVED WLSDM email alerts going to junk folder in outlook
      General Support & Troubleshooting • emailalerts wlsdm • • wlcommunityusers

      2
      0
      Votes
      2
      Posts
      1761
      Views

      wlsdmsupport

      Hi,

      “admin@wlsdm” is default sender (from) address for WLSDM and your mail client may not accept it.

      To change sender address:

      • Go to “Configuration > WLSDM System Settings” page
      • Select the “mail.account” tab
      • Edit the “mail.account.smtp.username” property (e.g. [email protected])

      settings.jpg

      Test changes :
      On “Configuration > WLSDM System Settings” page; open “Page Operations” menu and click “Test Email Settings” button

      poperations.jpg

      testmail.jpg

    • Getting "numeric attribute must be exist" error when defining new custom Devops MBean
      General Support & Troubleshooting • attribute weblogic wlsdm numeric • • wlcommunityusers

      2
      0
      Votes
      2
      Posts
      1718
      Views

      wlsdmsupport

      Hi,

      The right side of equal char which is attributeValue must be only numeric values.Probably your script contains string and you need to trim string chars.

      Also the first “/” should be replaced, too. Here is sample blog for your reference. One of our community user; used below script for doing it.

      http://mathiassalgado.blogspot.com/2017/06/add-metric-options-to-devops-mbean-with-wlsdm-weblogic-console.html

      script→ df -H | grep -vE ‘^Filesystem|tmpfs|media’ | awk ‘{ print $6"="$5}’ | sed ‘s/%//’ | sed ‘2s///ROOT/’ | sed ‘s///_/g’

      I recommend filter the result set; it does not make sense to use every result for “df –h” . i.e. you /etc, /dev, proc, system… Only consider the mount points which relevant with WebLogic JVM processes.

      Regards…

    • How should I search two different string in WLSDM Log Inspector?
      General Support & Troubleshooting • queries log inspector weblogic • • wlcommunityusers

      2
      0
      Votes
      2
      Posts
      1808
      Views

      wlsdmsupport

      Hi,

      WLDF Query Language is not supporting in diagnostic log monitoring because diagnostic log monitoring is a special solution.

      Firts of all, is strings connecting with “OR” or “AND” ?

      If you are using“OR”, you must define two different search for two different defination.

      If you are using “AND”, you can replace search string with exact defination.

      You can search string as below.

      Diagnostic log row: [ACTIVE].ExecuteThread: ‘2’ for queue: ‘weblogic.kernel.Default (self-tuning)’] [userId: ][APP: Service Bus Kernel] [partition-name: DOMAIN] [tenant-name: GLOBAL] [oracle.soa.tracking.InstanceId: 14216584] [oracle.soa.tracking.SCAEntityId: 10537] [oracle.soa.tracking.FaultId: 2252239] [FlowId: 0000Lu^vEciEoI04jz_Aio1PjgB80001jW] Outbound.B2BI/pipeline/vendor**/Unhandled error caught by system-level error handler: com.bea.wli.sb.pipeline.PipelineException: Service Unavailable**

      Search string: “/Unhandled error caught by system-level error handler: com.bea.wli.sb.pipeline.PipelineException: Service Unavailable”

    • Generic DevOps MBean no response captured error
      General Support & Troubleshooting • wlsdm console weblogic • • wlcommunityusers

      2
      0
      Votes
      2
      Posts
      2001
      Views

      wlsdmsupport

      Hi,

      Yo need to edit script according to your environment.

      · http://community.wlsdm.com/topic/38/monitor-webservice-response-times-with-curl-alldetails-on-weblogic

      Add soap-request.xml to server and replace à -d@/Users/admineer/u01/scripts.imac/curl.ws/soap-request.xml

      Replace /Users/admineer/u01/scripts.imac/curl.ws/response.xml

      Replace (Also add to server) “@/Users/admineer/u01/scripts.imac/curl.ws/curl-format.txt”

      For testing below script the server must access the http://www.webservicex.net/globalweather.asmx URL. I am highly recommending test with an “inhouse” business Webservice. You need to reconfigure this according to your service.

      Regards…

    • R

      SOLVED ProxyService Performance page on OSB not showing the details
      General Support & Troubleshooting • proxyservice pe • • Ramanpreet_Singh

      4
      0
      Votes
      4
      Posts
      1636
      Views

      wlsdmsupport

      @Ramanpreet_Singh

      Yes, everthing was just fine. If you want to remove buffer on WebLogic decrease the buffer size to “0” on “WebLogic console > $Server_Name > Logging > HTTP Logs > Advanced > Buffer Size” section.

      Regards…

    • R

      SOLVED Unable to login using Monitor Access user
      General Support & Troubleshooting • user access • • Ramanpreet_Singh

      6
      0
      Votes
      6
      Posts
      1835
      Views

      wlsdmsupport

      @Ramanpreet_Singh

      Hi Ramanpreet,
      We are happy to solve your issues. Thank you for the affirmative report.
      Always use $IP:$PORT/console/WLSDM direct URL for accessing WebLogic WLSDM console.

    • R

      Import Export the configuration for Datasource
      General Support & Troubleshooting • datasource conf • • Ramanpreet_Singh

      4
      0
      Votes
      4
      Posts
      3690
      Views

      wlsdmsupport

      @Ramanpreet_Singh Hi,

      Export/Import feature is used for WLSDM settings. Nothing related about WebLogic configuration.

      i.e. If you configured SMTP settings on WLSDM; these values will come from export file or DevOps Mbeans and any other WLSDM configuration you have done.

      Kind Regards…

    • R

      How to delete the metric
      General Support & Troubleshooting • delete the metr • • Ramanpreet_Singh

      2
      0
      Votes
      2
      Posts
      1663
      Views

      wlsdmsupport

      Hi @Ramanpreet_Singh,

      Currently, you cannot. But we will add this feature to next release.

    • J

      File Read/Write Events Not captured
      General Support & Troubleshooting • • jeba

      3
      0
      Votes
      3
      Posts
      1561
      Views

      wlsdmsupport

      @jeba said:

      Hi,

      On the Back End Reporting, by default EJB and JDBC events are captured and alerted. This is useful. But there are options like File Read, File Write and Web Service calls on the Back End Reports. We enabled these options for the Managed Server but none of these events are captured or displayed in those reports. But while restarting the Managed Server, if we include this JVM option,
      “-XX:FlightRecorderOptions=defaultrecording=true”
      Then I am able see all those File Read and File Write events are displayed and alerted. After removing the JFR default recording, then no events are captured. Is there any option or config we need? The downside of keeping the defaultrecording ON is that the Managed Server generates the JFR recording and the disk space grows exponentially which we don’t want.

      Thanks,
      Jeba.

      Hi Jeba,

      We analyzed your WebLogic monitoring request again and here our solution offer.

      Please remove “-XX:FlightRecorderOptions=defaultrecording=true”, you do not need this option while using WLSDM. If you still want to see File/Socket events you should increase your WLDF Diagnostic volume on WebLogic.
      Go to “Servers > $ManageServerName > General (tab)” page and set “Diagnostic Volume” high. Then you are able to see file read/write events.

      Note: This option means additional overhead on your managedservers; just activate only one managedserver which file read/write monitoring is important.

      image.png

      Keep your file and socket read/write definitions on WLSDM.

      Restart your managed server (it is needed after JVM parameter removing).

      This is the best setup for monitoring your file/socket events. By this configuration you will not face any disk problem. Because; WLSDM will take care of JFR files.

      Regards…

    • J

      CPU Load Alert Notification
      General Support & Troubleshooting • • jeba

      3
      0
      Votes
      3
      Posts
      2076
      Views

      J

      Thank you so much. I will give it a try and let you know whether this works in our scenario or not. Thanks.

    • R

      Customize the email/alert subject
      General Support & Troubleshooting • email cutomizat • • Ramanpreet_Singh

      4
      0
      Votes
      4
      Posts
      1747
      Views

      wlsdmsupport

      @Ramanpreet_Singh yes you can customize the subject.

    • wlcommunityusers

      SOLVED SMTP Configuration On WLSDM WebLogic Console's wizard ?
      General Support & Troubleshooting • weblogic wlsdm email • • wlcommunityusers

      2
      0
      Votes
      2
      Posts
      2008
      Views

      wlsdmsupport

      Problem is resolved by adding username and removing password. Then the WLSDM email SMTP configurations has been setup successfully for WebLogic.

    • SOLVED How to Configure LOG Monitoring Frequency ?
      General Support & Troubleshooting • wlsdm console weblogic • • wlcommunityusers

      3
      0
      Votes
      3
      Posts
      1773
      Views

      wlsdmsupport

      Log Monitoring cycle default value is 120 seconds. You can configure it from “Configuration > WLSDM System Settings” page’s “system.monitoring” tab, property as below. It effects back-end, loginspector and response times frequency. No problem until 60 seconds but we suggest 120 seconds for high transaction traffic.

      LOG.png

    • M

      Field Display problem on OSB Service Performance Report Page
      General Support & Troubleshooting • service performance display issue osb • • maas

      2
      0
      Votes
      2
      Posts
      1637
      Views

      wlsdmsupport

      Hi maas,

      Thank you for bug report. We noticed that problem and we will work on it to fix. Problem will be resolved at the next WLSDM release.

    • M

      Negative Value Displaying on SOA Composite Perfomance Dashboard / Report Page
      General Support & Troubleshooting • performance bpel soa composite report • • maas

      2
      0
      Votes
      2
      Posts
      1521
      Views

      wlsdmsupport

      Hi maas,

      Thank you for bug report.

      This bug is reported before and we have fixed the problem.

    • H

      Log Monitoring WLSDM Query Issue
      General Support & Troubleshooting • • han

      2
      0
      Votes
      2
      Posts
      1304
      Views

      wlsdmsupport

      Hi han,

      This bug is fixed. if you are using any release of v2, please upgrade your WLSDM product to v3. And don’t worry you will not lost any data.

    • Add new metric screen can not to be closed
      General Support & Troubleshooting • • mathias_

      2
      0
      Votes
      2
      Posts
      1685
      Views

      wlsdmsupport

      Hi Mathias,

      Thank you for bug report.We noticed that problem and we will work on it to fix. Problem will be resolved at the next WLSDM release.

    • Historical MBean Data: ActiveConnectionsCurrentCount
      General Support & Troubleshooting • weblogic wlsdm activecurrentco console • • wlcommunityusers

      2
      0
      Votes
      2
      Posts
      1722
      Views

      wlsdmsupport

      Hi,

      Dashboard pages stores only last 24 hours data.

      Older data: If the store data is active for the relevant metrics, you can find it on the “Reports> Metric Reports” page.

      Thank you.

      answer.png

    • WLSDM Upgrade
      General Support & Troubleshooting • version31 weblogic wlsdm • • wlcommunityusers

      2
      0
      Votes
      2
      Posts
      2435
      Views

      wlsdmsupport

      Hi,

      We are supporting upgrade from 2.5.2 to 3.1.1.
      Consider upgrade steps then your collected data will be kept and you won’t lost any data. But please take a back-up of WLSDM runtime folder which is located under $DOMAIN_HOME/WLSDM while your admin server is shut down.

    • Can we redirect JFR writing to WLSDM folder ?
      General Support & Troubleshooting • jfr weblogic wlsdm • • wlcommunityusers

      2
      0
      Votes
      2
      Posts
      1639
      Views

      wlsdmsupport

      Hi,

      We are not generating JFR files under /tmp folder. WebLogic does this and we’re using the output. So, if you want to redirect to custom folder please use below settings and let us know the result.

      Navigate to Enviroment > Server > Server Start. In “Arguments”, add: “-XX:FlightRecorderOptions=repository=/path/to/tmp/” JVM flags then restart WebLogic managed server(s)

    • With WLSDM WebLogic console, can we monitor deadlock in JVM threads ?
      General Support & Troubleshooting • weblogic wlsdm jvm threads • • wlcommunityusers

      2
      0
      Votes
      2
      Posts
      1829
      Views

      wlsdmsupport

      We have Thread Dump action. Just activate ThreadDump action for Hoggers or Stuck metrics and then analyze thread dumps by using “Thread Dump Analyser”. If your Administrator good enough you can write your own scripts for detecting deadlocks on JVM threads.

      Normally, WLSDM stores 24 hours data storage for MBeans and backend usage by default. But, all chart values can be stored on WLSDM database by turning it on. You can turn on “Store Data” for every data while setting up WLSDM wizard. After the installation, if you have not turned on “store date”, you need to open them by one by. Good news, you can sort them all on "
      • Configuration
      • > JMX MBean Metric Browser & Settings” page by sorting “Store Data” column. Just follow notifications on relevant notifications page. They’re stored for three months. Remember we have PURGE and ARCHIVE modules. You do not need to operation your monitoring console. It does everything for you.

      StoreData.png

    • How can i pass this WLSDM WebLogic wizard step?
      General Support & Troubleshooting • wizard weblogic wlsdm • • wlcommunityusers

      6
      0
      Votes
      6
      Posts
      1878
      Views

      wlsdmsupport

      Thank you for your interest. We trust our product very much and we thought every detail for WLSDM.

      Here our comments;

      First of all, your domain is really big and massive. But, we it is for sure we can handle it.

      1 - For my experience what make the difference is collecting data… In order to monitoring historic information anda data (this help me in troubleshooting)
      Yes, especially this size of domain is very hard to monitor. If you have any unused server, datasource, JMS definion please delete all, after that fresh resinstall WLSDM and do not track unused apps, servers, deployments… etc.
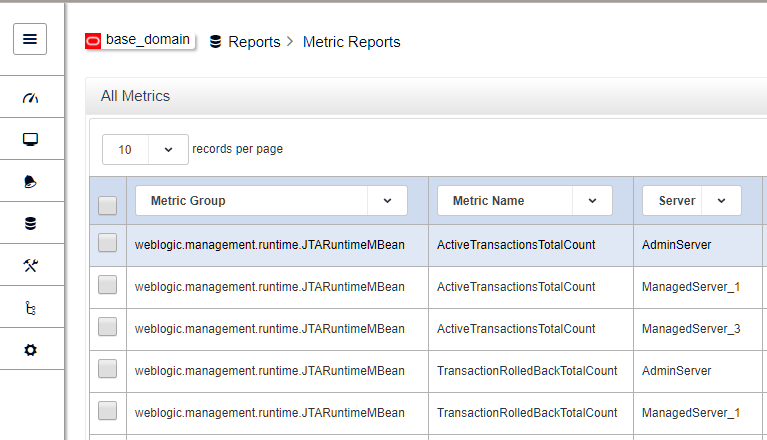
      Historical data would be very useful for your problem troubleshooting. Especially, check notification pages.

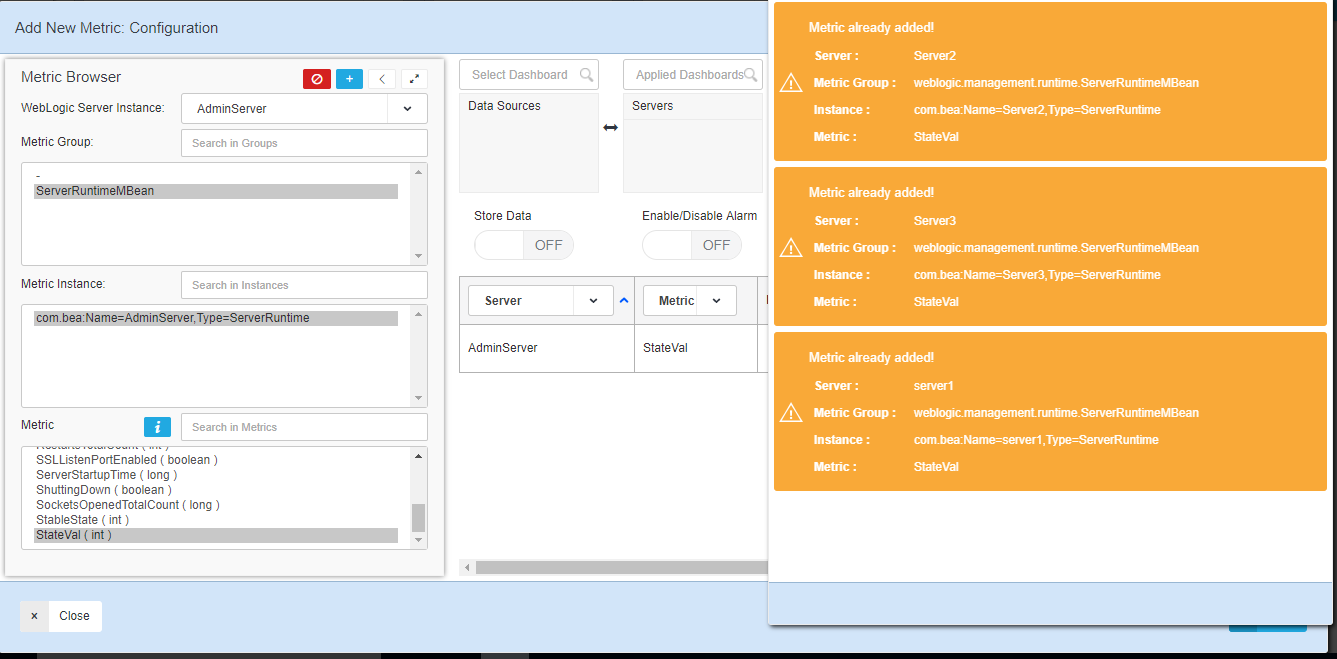
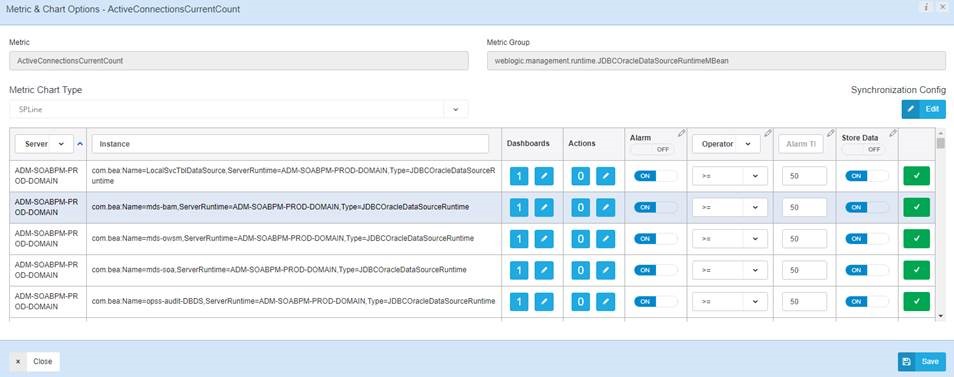
      2 - About deployments table your dashboard use to list applciation status in evey servers of my cluster and it is a little bit redundat
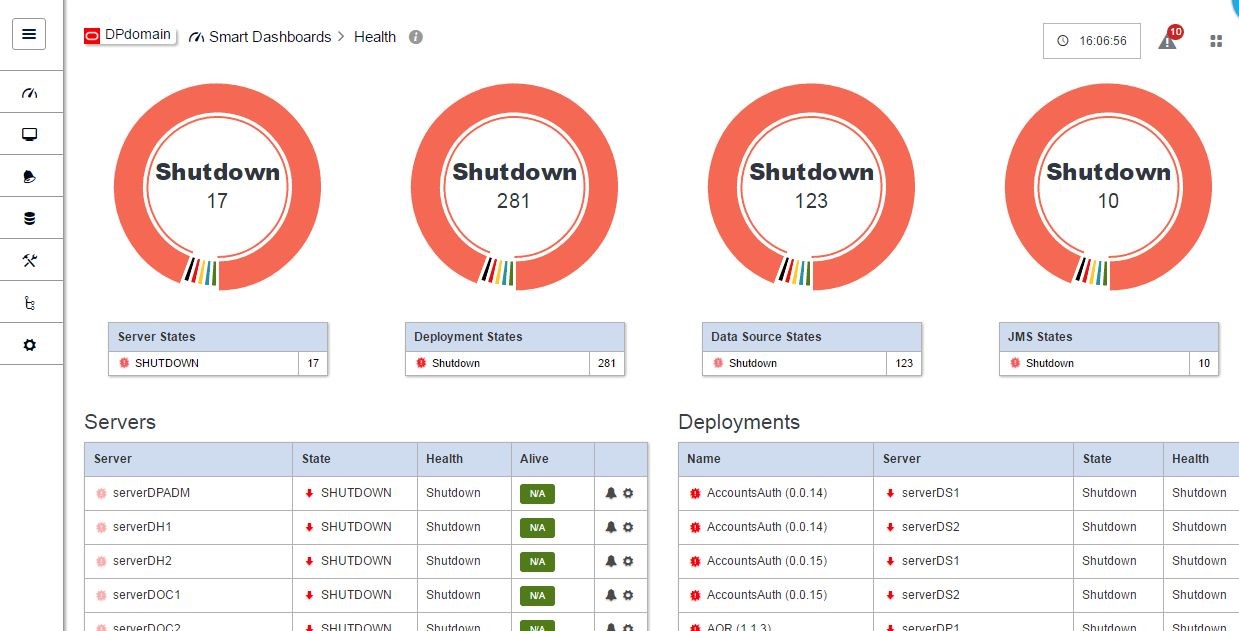
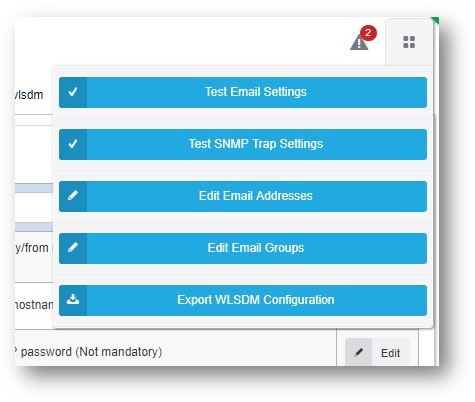
      We have asynchronous backend health feature on health dashboard. Could you please enable it and let us know the result? (Go to Health Dashboard page, > Page Operations Menu> Switch the below button to ON)

      save.jpg

      By the way, we have JMX/t3 timeout on system.WLSDM tab at System Settings page. If your domain is not responsive has its own problem, we are cutting the request because of keeping WebLogic domain healthy. It’s default value is about 5sec. That’s why you can see the health status conflicts.

    • wlcommunityusers

      How many languages supporting WLSDM scripting tool, when monitoring WebLogic ?
      General Support & Troubleshooting • weblogic wlsdm scripts • • wlcommunityusers

      2
      0
      Votes
      2
      Posts
      1723
      Views

      wlsdmsupport

      We support shell and batch (.sh and .bat/.cmd) OS script execution for custom metric actions. You can trigger any python/jython/wlst script by using WLSDM WebLogic console. We do not support script scheduling because of DevOps support. Scripts triggering is fully parametrical and can be assign to any specific MBean threshold.

    • wlcommunityusers

      Can we create our own actions except default actions ?
      General Support & Troubleshooting • console alert wlsdm weblogic • • wlcommunityusers

      2
      0
      Votes
      2
      Posts
      1529
      Views

      wlsdmsupport

      Thanks for this wonderfull question !
      Unlimited custom actions can be added on "Configuration > User Defined Metric Actions” page.

      Here is a tutorial about adding custom actions for your reference: http://www.wlsdm.com/tutorials/advanced-weblogic-monitoring-develop-jmx-mbeans-and-automate-with-wlsdm-metric-actions.php

    • 1
    • 2
    • 3
    • 4
    • 5
    • 6
    • 5 / 6