Hi,
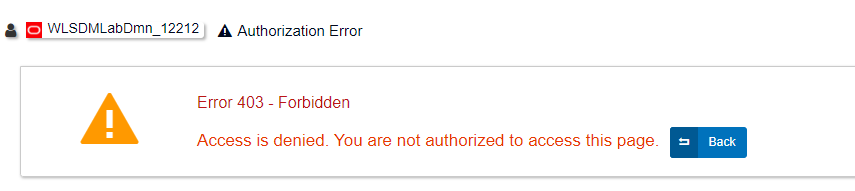
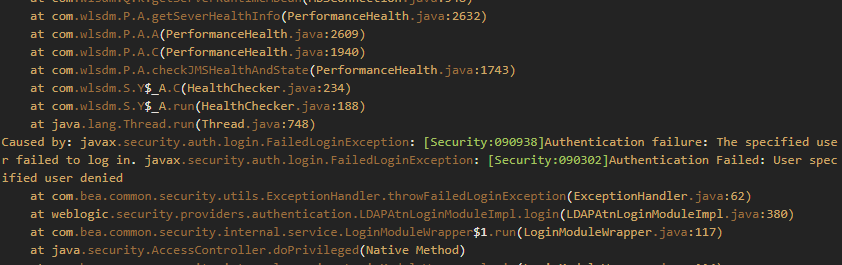
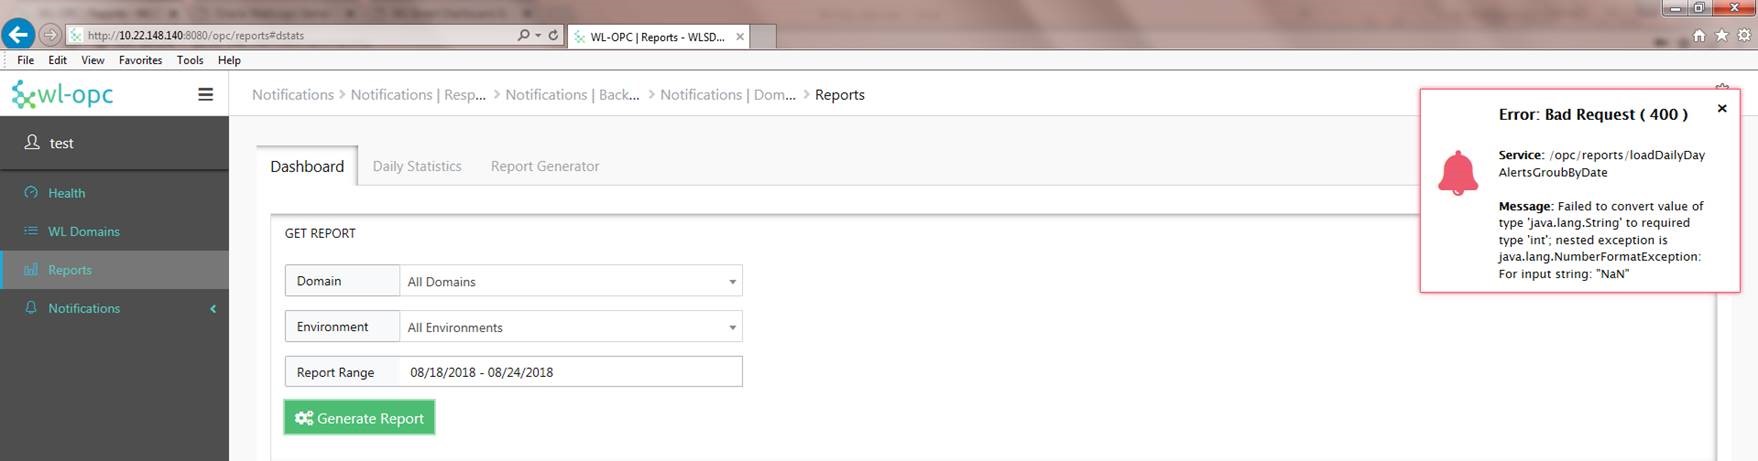
Non-adminstrator users not allowed for administrative operations by default as below screenshots.
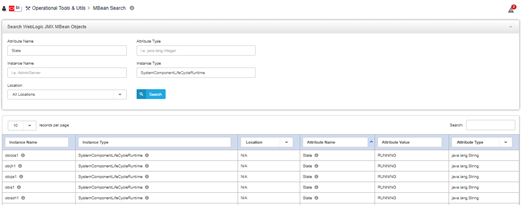
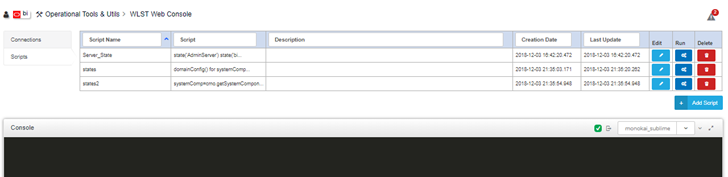
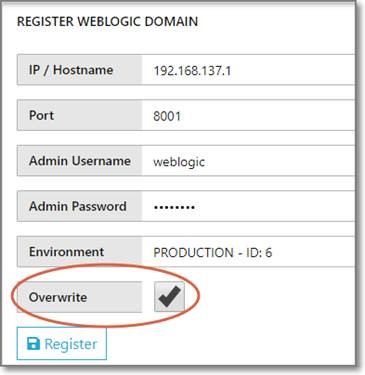
Metric configuration for monitor user:
2..png
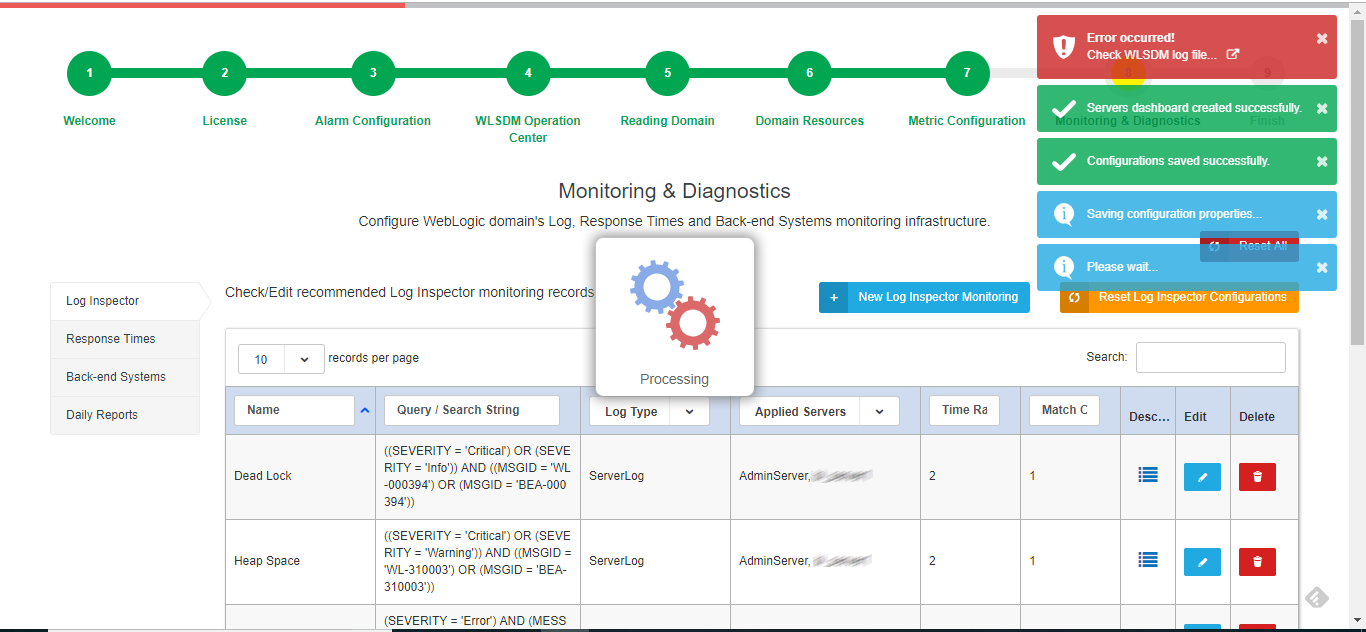
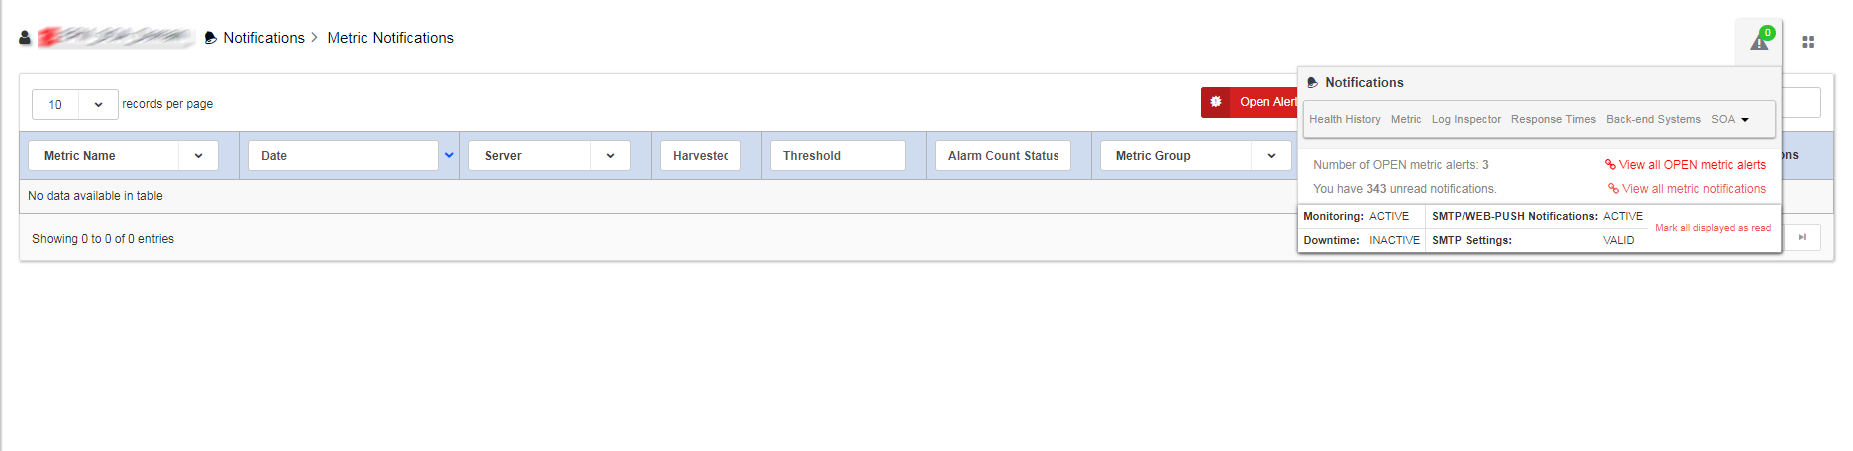
Metric configuration for adminstrator user:
3..png
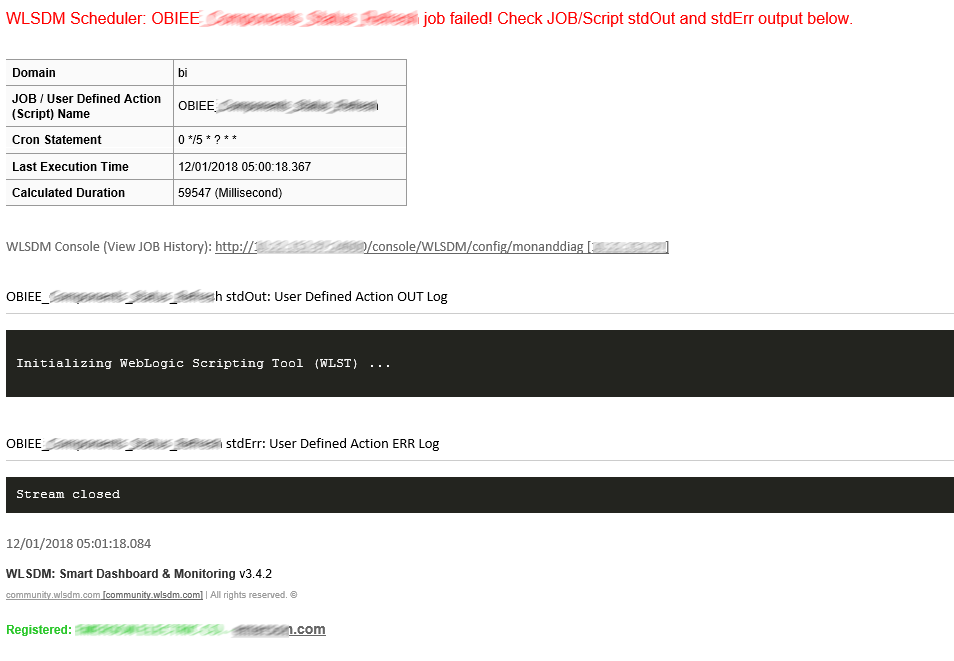
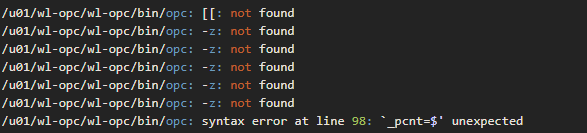
File explorer for monitor user:
4..png
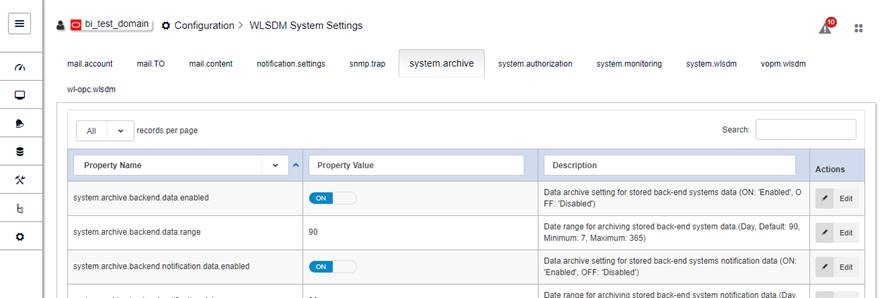
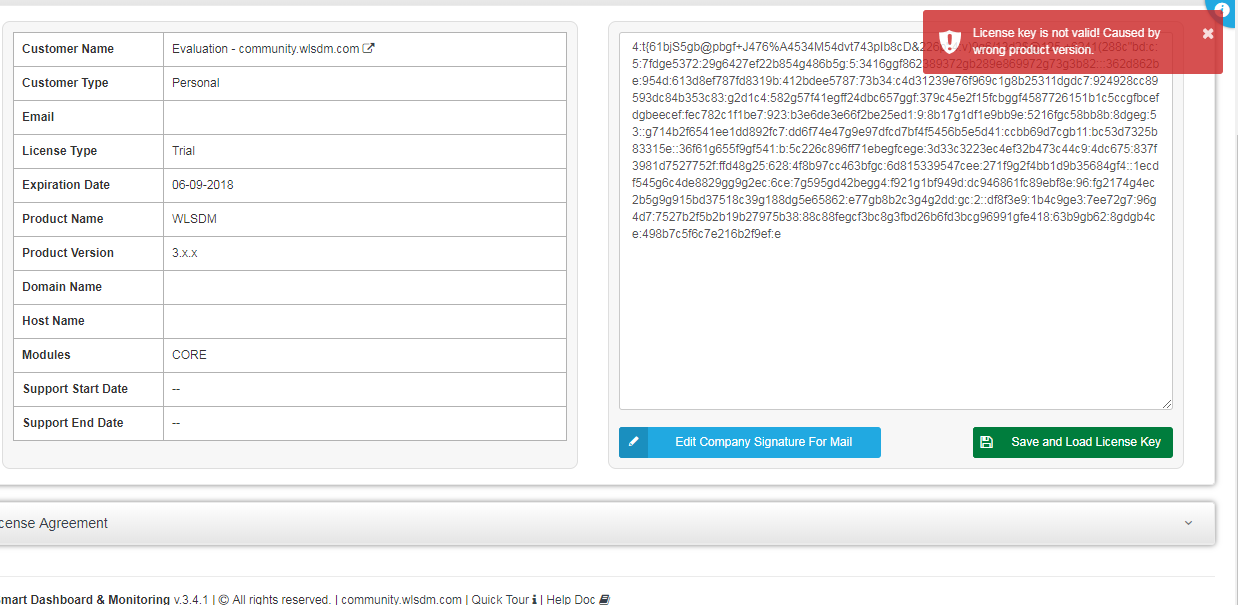
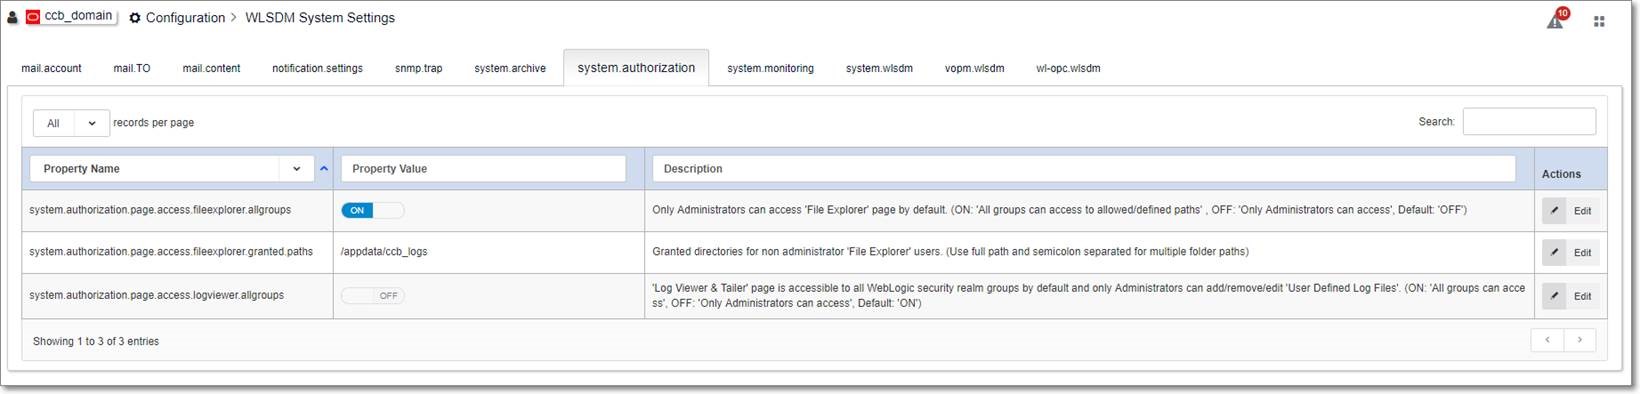
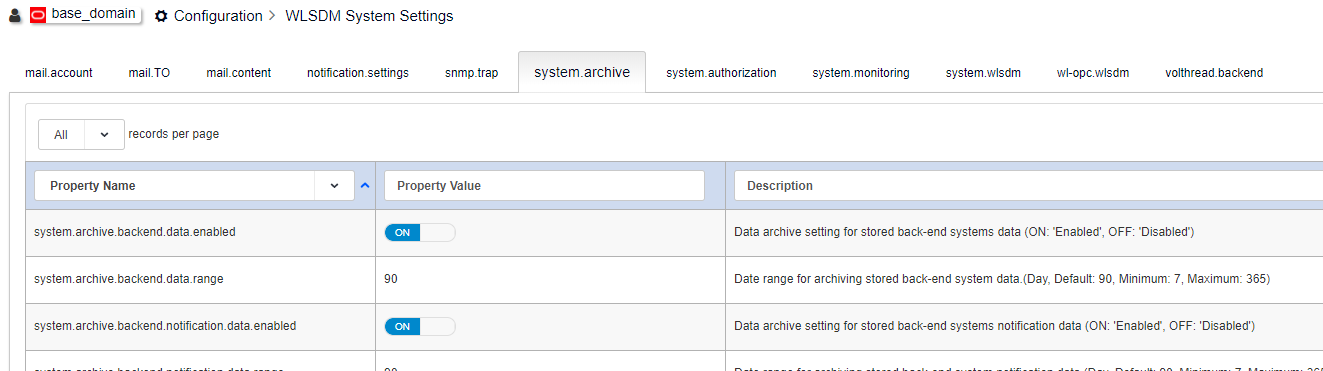
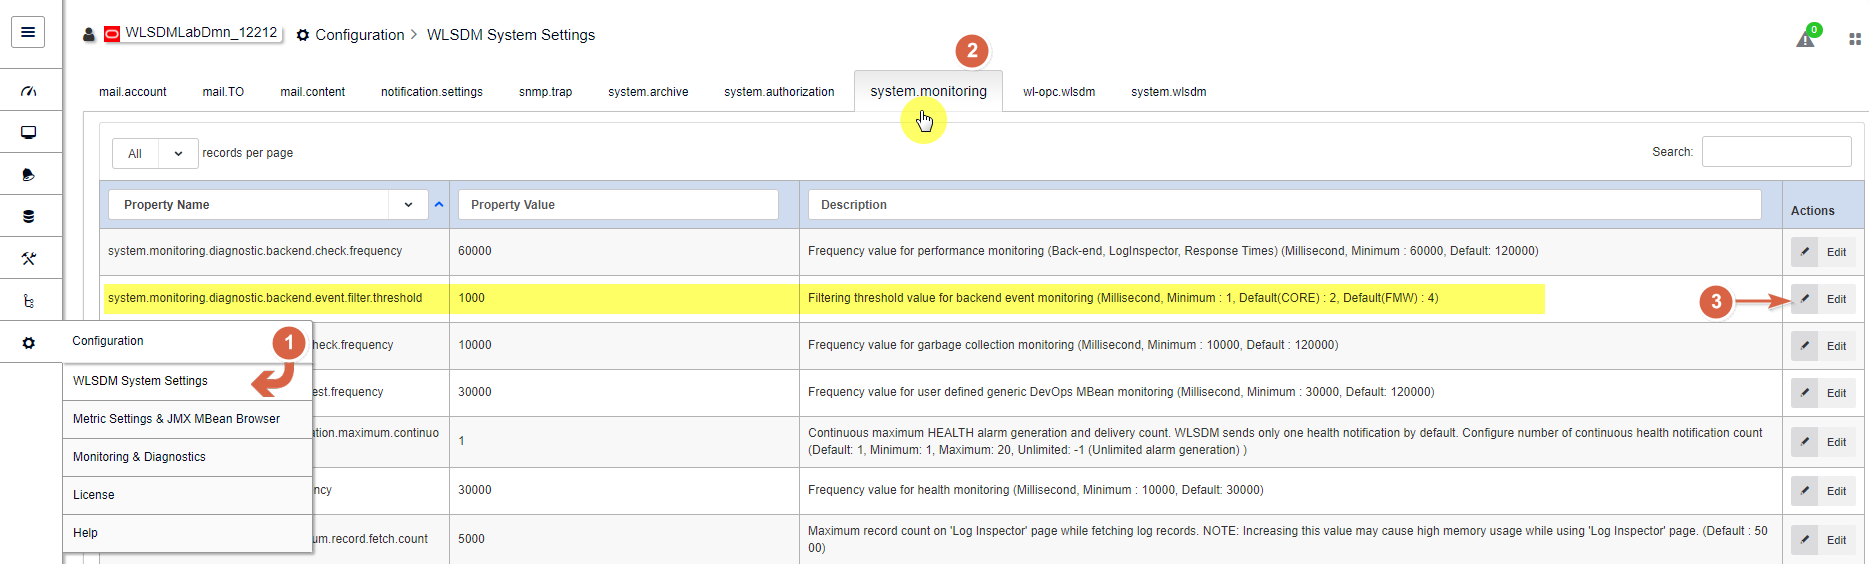
You can change access restriction configuration in “WLSDM System Settings > system.authorization” page.
Default value is OFF in “system.authorization.page.access.fileexplorer.allgroups” feature. It means only administrators can access to “file explorer”. If you turn on this feature, you must set access path for non-adminstrator users then non-adminstrator users only can access the path(s).
You can restrict log viewer access configuration via “system.authorization.page.access.logviewer”. Default value is on, it means all users can access log viewer, if you turn off this feature, non-adminstrator users will not able to access logviewer.
56.jpg


